

Beginning Classification in Machine Learning(ML)
Beginning Classification in Machine Learning(ML)
Classification types and a short example

What you will learn in this post?
Learn the basics of classification.
Generate binary classification. Passed or Failed in our case.
Classify outcomes using the Tree Classifier of sklearn. We use the tree.DecisionTreeClassifier.
Find the probability of different outcomes.
Display the outputs in graphical form using Matplotlib.
The two main features of Machine Learning are Prediction and Classification.
In Prediction we seek to find values of certain variables in the future based on trends observed in the past. For instance the share price of a particular company two months hence. We did a short example on this in our previous post. It is available at this

.
Classification is enumerating into categories.
Classification is of three types.
Binary. Things are classified into 2 groups yes and no. The simplest would be pass or fail, win or lose, watch the movie or not.
Multi-class. Multi-class differs from Binary in the sense that there are many possible groups. However, the outcome will still belong to one class only.
Some examples would be an exam result divisions like fail, third division, second division and first division. A movie classified as comedy, suspense, tragedy etc. A blog can be based on films, travel, literature etcMulti-label classification. Same as multi-class with the caveat that it can have more than one label. The labels are non exclusive, whereas in Multi-class they are exclusive. For instance we can have an email classified as non-spam and financial. A site can be a travel blog and also a foodie. Movies can belong to more than one genre.
We will start our journey into classification with a result classification problem.
For classification we will use the Tree classifier at sklearn. The documentation is available here.
Sklearn Tree Documentation
For graphs we will be using Matplotlib Pyplot.
To understand all this let us develop a program that classifies student performance based on marks. To begin with we will cheeck for pass and fail only.
To start with we will import the required packages.
from sklearn import tree
import matplotlib.pyplot as plt
Next we will write the classification functions. This is strictly for pass and fail only. Marks less than 40 is fail.
#Functions for pass and fail only
def divisions(n):
# Convert numeric division code to text
if n==2:
return "fail"
return "pass"
def classifications(n):
# Less than 40 is fail and the numeric code is 2.
# Pass numeric code is 1
if n<40:
return 2
return 1
The input section is next
inputmarks=[50,45,66,7,89,21,39,40,89]
inputmarks.sort()
marks=[[x] for x in inputmarks]#Classification needs input as a 2d array
#Use one of the following three
results=[classifications(x) for x in inputmarks]#Calculated
#results= [4, 4, 4, 3, 3, 2, 1, 1,1]# Input Results
#results= [4, 4, 1, 3, 3, 2, 1, 1,1]# Input Results with error
#results= [4, 4, 1, 1, 1, 1, 1, 1,4]# Input Results with fail pass error
#results= [4, 4, 4, 3, 3, 2, 1, 1,4]# Input Results with labeling error. 89 = both1 and 2
textresults=[divisions(x) for x in results]# Print results in words
We will use the calculated case here and the result will be pass and fail only.
Create the classsifier and the model now
classifier = tree.DecisionTreeClassifier()
model = classifier.fit(marks, results)
Create the predicted data for the input marks 0 to 100
fullmarksrange=[x for x in range(101)]
fullresultrange=[model.predict([[x]])[0] for x in fullmarksrange]
print(fullresultrange)
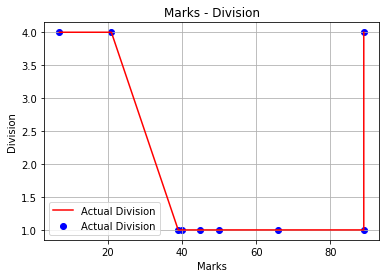
Run the plotter and view the graph of the input and calculated output
plt.plot(marks,results,color='red')
plt.scatter(marks,results,color='blue',marker='o')
plt.grid()
plt.xlabel('Marks')
plt.ylabel('Division')
plt.title("Marks - Division")
plt.legend(["Actual Division","Actual Division"])
plt.show()
Calculated graph of pass and fail

The input data. Please bear in mind that the Results numeric and the Input marks are the only two inputs to the classifier.

Check the predicted data now
plt.plot(fullmarksrange,fullresultrange,color='green')
plt.scatter(marks,results,color='brown',marker='o')
plt.grid()
plt.xlabel('Marks')
plt.ylabel('Division')
plt.title("Predicted Marks - Division")
plt.legend(["Predicted Division","Predicted Division"])
plt.show()
Predicted data graph

The last section prints the predicted labels for the marks from 0 to 100.
for i in range(101):
  value=[[i]]
  result=model.predict(value)
  probability=model.predict_proba(value)
  print("[Marks ",value[0][0], " result is ",divisions(result) , " prob is ", probability[0],"]",end=",")
  if i % 10==0 and i>0:
    print()
Here is the output.
Predicted data

Check the point where it goes from fail to pass and also check the probability.
Now, we will run the program with a changed input and present the outputs.
inputmarks=[50,45,66,7,89,21,39,40,89]
inputmarks.sort()
marks=[[x] for x in inputmarks]#Classification needs input as a 2d array
#Use one of the following three
#results=[classifications(x) for x in inputmarks]#Calculated
#results= [4, 4, 4, 3, 3, 2, 1, 1,1]# Input Results
#results= [4, 4, 1, 3, 3, 2, 1, 1,1]# Input Results with error
results= [4, 4, 1, 1, 1, 1, 1, 1,4]# Input Results with fail pass error
#results= [4, 4, 4, 3, 3, 2, 1, 1,4]# Input Results with labeling error. 89 = both1 and 2
textresults=[divisions(x) for x in results]# Print results in words
Results. Check the graphs, predictions and the probabilities.


This post will be continued…
The source code is at this link.
Thanx Sir
knowledge gaining article🙏