

Beginning Linear Regression
Beginning Linear Regression
and understanding the most basic and most important concept in Prediction.

Regression is a mathematical algorithm by which we can fit observed data to a mathematical function. It is based on minimizing the least mean square difference between the observed data and the prediction by the function.
Linear Regression fits a straight line equation to the data.
What you will learn in this post?
Take as input two lists Y and X and fit an equation Y=mX + c to the data.
Generate scatter plots and line plots of the input data
Fit a straight line to the given data and generate a model based on this.
Predict the output (Y) values for any given input X. In our case we will be predicting the sales given the marks in a training session attended by a sales person.
Find the coefficient of correlation, that is a measure of the reliability of our predictions. A value of 1 means a perfect fit and 0 means no fit. -1 means an inverse relation where Y decreases if X increases. An example would be a reduction in disease after an increase in cleanliness.
We will be programming on Colab, so if you are not familiar with it then please check out or post on this.

A company runs a training session for its salesmen and after that they are put to a test.
Here is a table showing their scores and weekly sales in 1000s.
Input Data
Salesman 1 2 3 4 5 6 7 8 9 10
Score 40 70 50 60 80 50 90 40 60 60
Sales(1000) 2.5 6.0 4.5 50 4.5 2.0 55 3.0 4.5 5.0
We will store these in 3 lists
salesmen=[1,2,3,4,5,6,7,8,9,10]
scores=[40,70,50,60,80,50,90,40,60,60]
sales=[2.5,6.0,4.5,5.0,4.5,2.0,5.5,3.0,4.5,5.0]
I have plotted the data here.
Scores of Salesmen

Sales of Salesmen

The company wants to evaluate the efficiency of the training. So, we need to generate data that shows the relationship between the test scores and the sales.
You can check the input data here.
Now, we will write code create 2 lists, one for the scores and one for the corresponding sales values. In case there are more than 1 value we will average it out.
Here is the relevant code.
uniquescores=list(set(scores))#Create a list without duplicates
uniquescores.sort()
d=dict()#Create a dictionary.
n=len(scores)
for i in range(n):
  key=scores[i]#Traverse all keys
  data=d.get(key)
  if data is None:
    d[key]=(sales[i],1)#If key not found add a tuple at the location in the form of the type (sales, frequency)
  else:
    d[key]=(sales[i] + data[0],1 + data[1])#If key  found update tuple at the location in the form of the type (sales, frequency)
salesperscore = [d[x][0]/d[x][1] for x in uniquescores]
print("Scores",uniquescores)
print("Sales",salesperscore)
Graph of Score v Sales
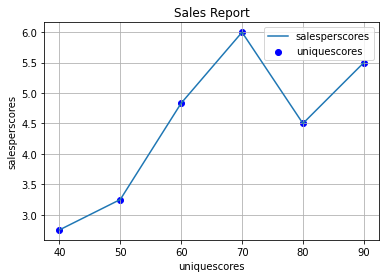
The graph shows that sales is generally increasing according to score.
Next we will try and fit a straight line to this data. To do this we will use the linregress of the Scipy Stats package.
The documentation for the function is at Scipy.Stat.lingress.
Here is the relevant code.
slope, intercept, correlationcoefficient, p, slopeerror = stats.linregress(uniquescores,salesperscore)
print("Slope=",slope,", Intercept=",intercept,", Correlation =",correlationcoefficient,",p=",p,"slope error=",slopeerror)
And the output is
Slope= 0.053333333333333344 , Intercept= 1.005555555555555 , Correlation = 0.7897252011120462 ,p= 0.06167453482719524 slope error= 0.020714741830409784
What do the outputs represent. We are fitting a straight line (y=mx+c) to the data. The slope is m and the intercept is c. The correlationcoefficient shows the degree of fit with 1 being perfect and 0 being no fit. Ours is around 0.8. High fit.
P checks for a horizontal line (m=0).
The last output is slope error.
Predicted line v actual data

Here is a link to the full source code on Colab.
The same code is on github at this link.
Thanks for sharing sir 🙏🙏
Thankyou Sir , this post has cleared my concept