

Classification based on Multiple Features.
theprogrammingsutras.substack.com
Classification based on Multiple Features.
A very simple example to begin multiple features classification

Continuing from our previous posts at

and
What you will learn in this post?
Generate Binary classifications based on multiple features.
Display using text and graphs.
This very short programs takes as input marks in 3 subjects and generates results pass and fail. A student is passed if he gets at least 40 in all subjects. To begin with we will import all required libraries.
Imports
import sys
import pandas
from sklearn import tree
from sklearn.tree import DecisionTreeClassifier
import matplotlib.pyplot as plt
The documentation is available at
Training Data and Maps
phy=[40,40,40,39]
chem=[40,39,40,40]
maths=[40,40,39,40]
result=["Pass","Fail","Fail","Fail"]
status = [1,0,0,0]
df=pandas.DataFrame({"PHY":phy,"CHEM":chem,"MATHS":maths,"RESULT":result,"STATUS":status})
resulttonumber = {'Fail': 0, 'Pass': 1}
numbertoresult = {0: 'Fail', 1: 'Pass'}

df['RESULT'] = df['RESULT'].map(resulttonumber)
print(df['RESULT'])

# df["STATUS"] = df["STATUS"].map(numbertoresult)
# print(df["STATUS"])

features = ['PHY', 'CHEM', 'MATHS']

X = df[features]
y = df['RESULT']

Generate the Decision Tree
dtree = DecisionTreeClassifier()
dtree = dtree.fit(X, y)
tree.plot_tree(dtree, feature_names=features)
sys.stdout.flush()
Lists to collect the inputs and results for plotting
physics=[]
chemistry=[]
maths=[]
results=[]
Prediction 1
marks={"PHY":[44],"CHEM":[45],"MATHS":[41]}
examplemarks=pandas.DataFrame(marks)
print("Marks",examplemarks)
result=dtree.predict(examplemarks)
df=pandas.DataFrame({"RESULT":result})
df['TEXTRESULT'] = df['RESULT'].map(numbertoresult)
print(df['TEXTRESULT'][0])
physics.append(marks["PHY"][0])
chemistry.append(marks["CHEM"][0])
maths.append(marks["MATHS"][0])
results.append(df["RESULT"][0])
Prediction 2
marks={"PHY":[1],"CHEM":[2],"MATHS":[2]}
examplemarks=pandas.DataFrame(marks)
print("Marks",examplemarks)
result=dtree.predict(examplemarks)
df=pandas.DataFrame({"RESULT":result})
df['TEXTRESULT'] = df['RESULT'].map(numbertoresult)
print(df['TEXTRESULT'][0])
physics.append(marks["PHY"][0])
chemistry.append(marks["CHEM"][0])
maths.append(marks["MATHS"][0])
results.append(df["RESULT"][0])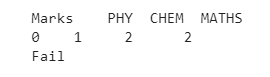
Prediction 3
marks={"PHY":[100],"CHEM":[39],"MATHS":[100]}
examplemarks=pandas.DataFrame(marks)
print("Marks",examplemarks)
result=dtree.predict(examplemarks)
df=pandas.DataFrame({"RESULT":result})
df['TEXTRESULT'] = df['RESULT'].map(numbertoresult)
print(df['TEXTRESULT'][0])
physics.append(marks["PHY"][0])
chemistry.append(marks["CHEM"][0])
maths.append(marks["MATHS"][0])
results.append(df["RESULT"][0])
Prediction 4
marks={"PHY":[50],"CHEM":[50],"MATHS":[40]}
examplemarks=pandas.DataFrame(marks)
print("Marks",examplemarks)
result=dtree.predict(examplemarks)
df=pandas.DataFrame({"RESULT":result})
df['TEXTRESULT'] = df['RESULT'].map(numbertoresult)
print(df['TEXTRESULT'][0])
physics.append(marks["PHY"][0])
chemistry.append(marks["CHEM"][0])
maths.append(marks["MATHS"][0])
results.append(df["RESULT"][0])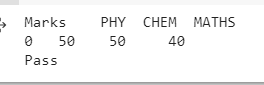
Prediction 5
marks={"PHY":[60],"CHEM":[65],"MATHS":[70]}
examplemarks=pandas.DataFrame(marks)
print("Marks",examplemarks)
result = dtree.predict(examplemarks)
df=pandas.DataFrame({"RESULT":result})
df['TEXTRESULT'] = df['RESULT'].map(numbertoresult)
print(df['TEXTRESULT'][0])
physics.append(marks["PHY"][0])
chemistry.append(marks["CHEM"][0])
maths.append(marks["MATHS"][0])
results.append(df["RESULT"][0])
Prediction 6
marks={"PHY":[40],"CHEM":[40],"MATHS":[40]}
examplemarks=pandas.DataFrame(marks)
print("Marks",examplemarks)
result = dtree.predict(examplemarks)
df=pandas.DataFrame({"RESULT":result})
df['TEXTRESULT'] = df['RESULT'].map(numbertoresult)
print(df['TEXTRESULT'][0])
physics.append(marks["PHY"][0])
chemistry.append(marks["CHEM"][0])
maths.append(marks["MATHS"][0])
results.append(df["RESULT"][0])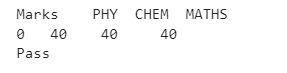
Prediction 7
marks={"PHY":[39],"CHEM":[85],"MATHS":[70]}
examplemarks=pandas.DataFrame(marks)
print("Marks",examplemarks)
result = dtree.predict(examplemarks)
df=pandas.DataFrame({"RESULT":result})
df['TEXTRESULT'] = df['RESULT'].map(numbertoresult)
print(df['TEXTRESULT'][0])
physics.append(marks["PHY"][0])
chemistry.append(marks["CHEM"][0])
maths.append(marks["MATHS"][0])
results.append(df["RESULT"][0])
Prediction 8
marks={"PHY":[39],"CHEM":[85],"MATHS":[70]}
examplemarks=pandas.DataFrame(marks)
print("Marks",examplemarks)
result = dtree.predict(examplemarks)
df=pandas.DataFrame({"RESULT":result})
df['TEXTRESULT'] = df['RESULT'].map(numbertoresult)
print(df['TEXTRESULT'][0])
physics.append(marks["PHY"][0])
chemistry.append(marks["CHEM"][0])
maths.append(marks["MATHS"][0])
results.append(df["RESULT"][0])
Prediction 9
marks={"PHY":[89],"CHEM":[100],"MATHS":[39]}
examplemarks=pandas.DataFrame(marks)
print("Marks",examplemarks)
result = dtree.predict(examplemarks)
df=pandas.DataFrame({"RESULT":result})
df['TEXTRESULT'] = df['RESULT'].map(numbertoresult)
print(df['TEXTRESULT'][0])
physics.append(marks["PHY"][0])
chemistry.append(marks["CHEM"][0])
maths.append(marks["MATHS"][0])
results.append(df["RESULT"][0])
Summing up with a plot.
n=len(physics)
x=[i+1 for i in range(n)]
pivot=[40 for r in x]
plt.scatter(x,physics,color="red",label="Physics")
plt.scatter(x,chemistry,color="blue",label="Chemistry")
plt.scatter(x,maths,color="pink",label="Maths")
normalizedresults=[r*50 + 25 for r in results]
plt.scatter(x,normalizedresults,color="green",label="Results")
plt.plot(x,pivot,color="black",label="Passing Pivot")
plt.ylabel('Marks')
plt.xlabel('SNo')
plt.title("Marks v Results")
plt.legend()
plt.show()
Perfect predictions with a training set of just 4 items. Look up the graph here, the student is failed wherever there is an entry below the 40 marks line.
The source code on Colab
I will explain further in the next post.
Please comment and share.🙂