Introduction to Matplotlib
Examples of all types of plots
Line Plots
Sine Plot
import matplotlib.pyplot as plt
import numpy as np
# Simple plots
# Generate some data for the plot
x = np.linspace(0, 10, 100)  # Create an array of 100 evenly spaced points between 0 and 10
y = np.sin(x)  # Calculate the sine of each x value

# Create a new figure and Axes object
fig, ax = plt.subplots()

# Plot the data as a line with red color, solid line style, and a linewidth of 2
ax.plot(x, y, color='red', linestyle='-', linewidth=2)

# Set the title, x-axis label, and y-axis label
ax.set_title('Sine Wave')  # Set the title of the plot
ax.set_xlabel('X-axis')  # Set the label for the x-axis
ax.set_ylabel('Y-axis')  # Set the label for the y-axis

# Add gridlines to the plot
ax.grid(True, linestyle='--', color='gray', alpha=0.5)

# Customize the tick labels and locations
ax.set_xticks(np.linspace(0, 10, 11))  # Set the x-axis tick locations to be 11 evenly spaced values between 0 and 10
ax.set_xticklabels(['0', '1', '2', '3', '4', '5', '6', '7', '8', '9', '10'])  # Set the x-axis tick labels to be string values
ax.set_yticks(np.linspace(-1, 1, 11))  # Set the y-axis tick locations to be 11 evenly spaced values between -1 and 1
ax.tick_params(axis='both', labelsize=10)  # Set the font size of the tick labels to 10

# Add a legend to the plot
ax.legend(['Sine Wave'], loc='upper right')

# Customize the spines
ax.spines['top'].set_visible(False)  # Hide the top spine of the plot
ax.spines['right'].set_visible(False)  # Hide the right spine of the plot
ax.spines['bottom'].set_linewidth(1.5)  # Increase the width of the bottom spine to 1.5
ax.spines['left'].set_position(('outward', 10))  # Move the left spine outward by 10 points

# Display the plot
plt.show()
Output
Sine and Cosine
import matplotlib.pyplot as plt
import numpy as np
# Multiple  plots
# Generate some data for the plot
x = np.linspace(0, 10, 100)  # Create an array of 100 evenly spaced points between 0 and 10
y_sin = np.sin(x)  # Calculate the sine of each x value
y_cos = np.cos(x)  # Calculate the cosine of each x value

# Create a new figure and Axes object
fig, ax = plt.subplots()

# Plot the sine and cosine waves with different colors and labels
ax.plot(x, y_sin, color='red', linestyle='-', linewidth=2, label='Sine')
ax.plot(x, y_cos, color='blue', linestyle='--', linewidth=2, label='Cosine')

# Set the title, x-axis label, and y-axis label
ax.set_title('Sine and Cosine Waves')
ax.set_xlabel('X-axis')
ax.set_ylabel('Y-axis')

# Add gridlines to the plot
ax.grid(True, linestyle='--', color='gray', alpha=0.5)

# Customize the tick labels and locations
ax.set_xticks(np.linspace(0, 10, 11))
ax.set_xticklabels(['0', '1', '2', '3', '4', '5', '6', '7', '8', '9', '10'])
ax.set_yticks(np.linspace(-1, 1, 11))
ax.tick_params(axis='both', labelsize=10)

# Add a legend to the plot
ax.legend(loc='upper right')

# Customize the spines
ax.spines['top'].set_visible(False)
ax.spines['right'].set_visible(False)
ax.spines['bottom'].set_linewidth(1.5)
ax.spines['left'].set_position(('outward', 10))

# Display the plot
plt.show()
Output
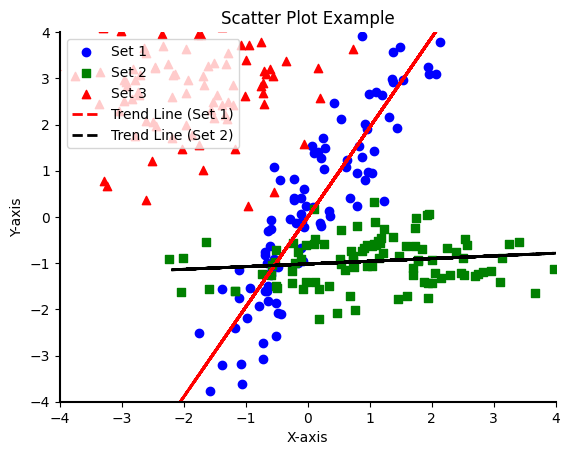
Scatter Plot
import matplotlib.pyplot as plt
import numpy as np
# Scatter plots
# Generate some random data for the scatter plot
x = np.random.normal(0, 1, 100)  # Generate 100 random values from a normal distribution with mean 0 and standard deviation 1
y = 2 * x + np.random.normal(0, 1, 100)  # Calculate y values as a linear function of x plus some random noise

# Generate two additional sets of random data
z = np.random.normal(1, 1.5, 100)  # Generate 100 random values from a normal distribution with mean 1 and standard deviation 1.5
w = np.random.normal(-1, 0.5, 100)  # Generate 100 random values from a normal distribution with mean -1 and standard deviation 0.5

# Create a new figure and Axes object
fig, ax = plt.subplots()

# Plot the data as a scatter plot with blue circles as markers
ax.scatter(x, y, color='blue', marker='o', label='Set 1')
ax.scatter(z, w, color='green', marker='s', label='Set 2')
ax.scatter(np.random.normal(-2, 1, 100), np.random.normal(3, 1, 100), color='red', marker='^', label='Set 3')

# Set the title, x-axis label, and y-axis label
ax.set_title('Scatter Plot Example')
ax.set_xlabel('X-axis')
ax.set_ylabel('Y-axis')

# Add a trend line to the plot using the np.polyfit() function
z1 = np.polyfit(x, y, 1)  # Calculate the coefficients for a linear trend line for Set 1
z2 = np.polyfit(z, w, 1)  # Calculate the coefficients for a linear trend line for Set 2
p1 = np.poly1d(z1)  # Create a polynomial function based on the coefficients for Set 1
p2 = np.poly1d(z2)  # Create a polynomial function based on the coefficients for Set 2
ax.plot(x, p1(x), color='red', linestyle='--', linewidth=2, label='Trend Line (Set 1)')  # Add the trend line for Set 1 to the plot
ax.plot(z, p2(z), color='black', linestyle='--', linewidth=2, label='Trend Line (Set 2)')  # Add the trend line for Set 2 to the plot

# Add a legend to the plot
ax.legend(loc='upper left')

# Customize the spines
ax.spines['top'].set_visible(False)
ax.spines['right'].set_visible(False)
ax.spines['bottom'].set_linewidth(1.5)
ax.spines['left'].set_linewidth(1.5)

# Set the limits and tick marks for the x-axis and y-axis
ax.set_xlim([-4, 4])
ax.set_ylim([-4, 4])
ax.set_xticks([-4, -3, -2, -1, 0, 1, 2, 3, 4])
ax.set_yticks([-4, -3, -2, -1, 0, 1, 2, 3, 4])

# Display the plot
plt.show()
Output
Bar Graphs
import matplotlib.pyplot as plt
import numpy as np

# Sample data
categories = ['Apples', 'Oranges', 'Bananas', 'Grapes']
values1 = [20, 15, 10, 25]
values2 = [15, 10, 15, 20]

# Create a bar plot with customizations
bar_width = 0.35
plt.bar(categories, values1, color='orange', alpha=0.5, edgecolor='black', linewidth=2, width=bar_width)
plt.bar(categories, values2, color='blue', alpha=0.5, edgecolor='black', linewidth=2, width=bar_width, bottom=values1)

# Add error bars
errors = [2, 1, 3, 2]
plt.errorbar(categories, values1, yerr=errors, fmt='none', capsize=5)
plt.errorbar(categories, values2, yerr=errors, fmt='none', capsize=5)

# Add annotations
for i, (v1, v2) in enumerate(zip(values1, values2)):
    plt.text(i-bar_width/2, v1+1, str(v1), ha='center', fontweight='bold')
    plt.text(i+bar_width/2, v2+1, str(v2), ha='center', fontweight='bold')

# Add a legend
plt.legend(['Sales 1', 'Sales 2', 'Error'])

# Add titles and labels
plt.title('Fruit Sales')
plt.xlabel('Fruit')
plt.ylabel('Number of Sales')

# Display the plot
plt.show()
Output
Histogram
import matplotlib.pyplot as plt
import numpy as np

# Generate some random data
data = np.random.normal(size=1000)

# Create a histogram with 20 bins
plt.hist(data, bins=20)

# Add labels and titles
plt.title('Distribution of Random Data')
plt.xlabel('Values')
plt.ylabel('Frequency')

# Display the plot
plt.show()
Output
Pie Chart
import matplotlib.pyplot as plt
import numpy as np

# Generate random data for the first pie chart
labels1 = ['A', 'B', 'C', 'D', 'E']
sizes1 = np.random.randint(1, 50, 5)

# Generate random data for the second pie chart
labels2 = ['F', 'G', 'H', 'I', 'J']
sizes2 = np.random.randint(1, 50, 5)

# Create a figure with two subplots
fig, (ax1, ax2) = plt.subplots(1, 2)

# Create the first pie chart
ax1.pie(sizes1, labels=labels1, autopct='%1.1f%%', startangle=90)
ax1.set_title('Pie Chart 1')

# Create the second pie chart
ax2.pie(sizes2, labels=labels2, autopct='%1.1f%%', startangle=90)
ax2.set_title('Pie Chart 2')

# Display the plot
plt.show()
Output
Box Plot
import matplotlib.pyplot as plt
import numpy as np

# Generate random data for three groups
data1 = np.random.normal(0, 1, 100)
data2 = np.random.normal(2, 1, 100)
data3 = np.random.normal(-2, 1, 100)
data = [data1, data2, data3]

# Create a boxplot
fig, ax = plt.subplots()
ax.boxplot(data)

# Add labels and title
ax.set_xticklabels(['Group 1', 'Group 2', 'Group 3'])
ax.set_ylabel('Value')
ax.set_title('Boxplot Example')

# Display the plot
plt.show()
Output
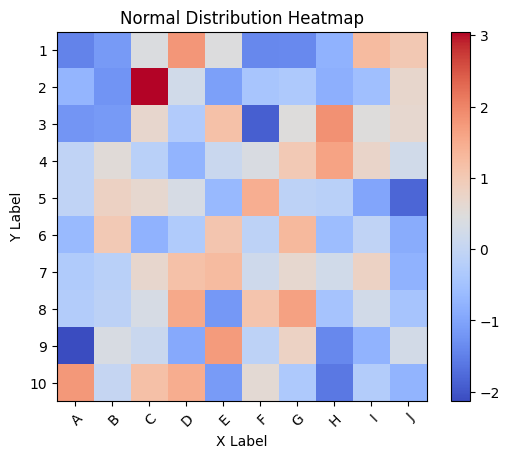
Heatplot
import numpy as np
import matplotlib.pyplot as plt

# Generate normally distributed data
data = np.random.normal(size=(10, 10))

# Create a heatmap
fig, ax = plt.subplots()
im = ax.imshow(data, cmap='coolwarm')

# Add a colorbar
cbar = ax.figure.colorbar(im, ax=ax)

# Add labels and title
ax.set_xticks(np.arange(10))
ax.set_yticks(np.arange(10))
ax.set_xticklabels(['A', 'B', 'C', 'D', 'E', 'F', 'G', 'H', 'I', 'J'])
ax.set_yticklabels(['1', '2', '3', '4', '5', '6', '7', '8', '9', '10'])
ax.set_xlabel('X Label')
ax.set_ylabel('Y Label')
ax.set_title('Normal Distribution Heatmap')

# Rotate the x-axis labels
plt.setp(ax.get_xticklabels(), rotation=45, ha='right', rotation_mode='anchor')

# Display the plot
plt.show()
Output
3D Plots
3D Mesh
import matplotlib.pyplot as plt
import numpy as np

# Create data
X = np.arange(-5, 5, 0.1)
Y = np.arange(-5, 5, 0.1)
X, Y = np.meshgrid(X, Y)
Z = np.sin(np.sqrt(X**2 + Y**2))

# Create a 3D plot
fig = plt.figure()
ax = fig.add_subplot(111, projection='3d')
ax.plot_surface(X, Y, Z, cmap='coolwarm')

# Add labels and title
ax.set_xlabel('X Label')
ax.set_ylabel('Y Label')
ax.set_zlabel('Z Label')
ax.set_title('3D Plot Example')

# Display the plot
plt.show()
Output
3D Scatter Plot
import matplotlib.pyplot as plt
import numpy as np

# Generate random data
x = np.random.normal(size=100)
y = np.random.normal(size=100)
z = np.random.normal(size=100)

# Create a 3D scatterplot
fig = plt.figure()
ax = fig.add_subplot(111, projection='3d')
ax.scatter(x, y, z, c='r', marker='o')

# Add labels and title
ax.set_xlabel('X Label')
ax.set_ylabel('Y Label')
ax.set_zlabel('Z Label')
ax.set_title('3D Scatterplot Example')

# Display the plot
plt.show()
Output
Happy reading🙂.


