

Is there a pattern in seemingly random data. Post 2 in the series.
Is there a pattern in seemingly random data. Post 2 in the series.
Random has patterns after all.

Beginning from our previous post at

In the previous post we examined different order polynomials and also explored fully random data. In this post we will add some randomness to our datasets and then check the results.
What you will learn in this post?
Add random data to prepared datasets and examine the results.
We will add only +ve random values, -ve random values, and both +ve and -ve.
Check whether fully random data from the random.randint function can be predicted.
We will consider Linear Regression only in this post.
To begin with I have created a enumerated type called RandomTypes.
import enum
class RandomTypes(enum.Enum):
   positive = 0
   negative = 1
   both = 2
Using this I created a function that adds random data to a series.
def randomize(x,randomtype):
  n=len(x)
  a=[i for i in x]
  for i in range(n):
    if randomtype==RandomTypes.positive:
      randomvalue=random.randint(0,5)
    elif randomtype==RandomTypes.negative:
      randomvalue=random.randint(-5,0)
    else:
      randomvalue=random.randint(-5,5)


    a[i]+=randomvalue

  return a
Let us test this function.
x=[2,2,2,2,2,2,2,2,2,2]
y=randomize(x,RandomTypes.positive)
print("Positive Random",y)
y=randomize(x,RandomTypes.negative)
print("Negative Random",y)
y=randomize(x,RandomTypes.both)
print("Positive Both",y)
Output

Now, we will try and predict different powered series directly and with different randomizations and view the results
Linear
x=[1,2,3,4,5,6,7,8,9,10]
y=[1,2,3,4,5,6,7,8,9,10]
degree=1
#Original
outputy=y
model = poly.polyfit(x, outputy, deg=degree)# Generate the model
predictedy=poly.polyval(x,model)
coeff=r2_score(outputy, predictedy)
print("Original","\nX",x,"Y",y,"\nOriginal Y",outputy,"\nPredicted Y",predictedy,"\n coefficient of correlation",coeff)
equation=str(numpy.poly1d(numpy.flip(model)))# Get the model output formatted as a equation. Model is an nparray, poly1d requires the array of coefficients in reverse order. Hence th flip.
print("The equation is Y=\n ",equation)
plt.scatter(x,y,color="orange")
plt.plot(x, y,'orange',label="Original Data")
plt.scatter(x,outputy,color="blue")
plt.plot(x, outputy,'blue',label="Original Data")
plt.scatter(x,predictedy,color="green")
plt.plot(x, predictedy,'green',label="Predicted Data")
plt.ylabel('Y')
plt.xlabel('X')
plt.title("Original")
plt.legend()
plt.show()
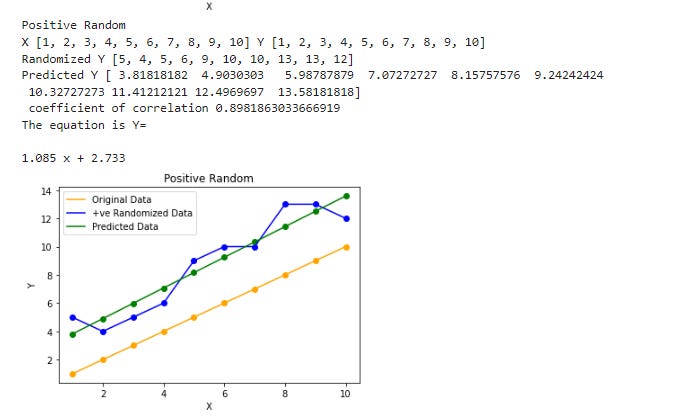
#Positive
outputy=randomize(y,RandomTypes.positive)
model = poly.polyfit(x, outputy, deg=degree)# Generate the model
predictedy=poly.polyval(x,model)
coeff=r2_score(outputy, predictedy)
print("Positive Random","\nX",x,"Y",y,"\nRandomized Y",outputy,"\nPredicted Y",predictedy,"\n coefficient of correlation",coeff)
equation=str(numpy.poly1d(numpy.flip(model)))# Get the model output formatted as a equation. Model is an nparray, poly1d requires the array of coefficients in reverse order. Hence th flip.
print("The equation is Y=\n ",equation)
plt.scatter(x,y,color="orange")
plt.plot(x, y,'orange',label="Original Data")
plt.scatter(x,outputy,color="blue")
plt.plot(x, outputy,'blue',label="+ve Randomized Data")
plt.scatter(x,predictedy,color="green")
plt.plot(x, predictedy,'green',label="Predicted Data")
plt.ylabel('Y')
plt.xlabel('X')
plt.title("Positive Random")
plt.legend()
plt.show()
#Negative
outputy=randomize(y,RandomTypes.negative)
model = poly.polyfit(x, outputy, deg=degree)# Generate the model
predictedy=poly.polyval(x,model)
coeff=r2_score(outputy, predictedy)
print("Negative Random","\nX",x,"Y",y,"\nRandomized Y",outputy,"\nPredicted Y",predictedy,"\n coefficient of correlation",coeff)
equation=str(numpy.poly1d(numpy.flip(model)))# Get the model output formatted as a equation. Model is an nparray, poly1d requires the array of coefficients in reverse order. Hence th flip.
print("The equation is Y=\n ",equation)
plt.scatter(x,y,color="orange")
plt.plot(x, y,'orange',label="Original Data")
plt.scatter(x,outputy,color="blue")
plt.plot(x, outputy,'blue',label="+ve Randomized Data")
plt.scatter(x,predictedy,color="green")
plt.plot(x, predictedy,'green',label="Predicted Data")
plt.ylabel('Y')
plt.xlabel('X')
plt.title("Negative Random")
plt.legend()
plt.show()
#Both
#Positive
outputy=randomize(y,RandomTypes.both)
model = poly.polyfit(x, outputy, deg=degree)# Generate the model
predictedy=poly.polyval(x,model)
coeff=r2_score(outputy, predictedy)
print("Both Random","\nX",x,"Y",y,"\nRandomized Y",outputy,"\nPredicted Y",predictedy,"\n coefficient of correlation",coeff)
equation=str(numpy.poly1d(numpy.flip(model)))# Get the model output formatted as a equation. Model is an nparray, poly1d requires the array of coefficients in reverse order. Hence th flip.
print("The equation is Y=\n ",equation)
plt.scatter(x,y,color="orange")
plt.plot(x, y,'orange',label="Original Data")
plt.scatter(x,outputy,color="blue")
plt.plot(x, outputy,'blue',label="Both Randomized Data")
plt.scatter(x,predictedy,color="green")
plt.plot(x, predictedy,'green',label="Predicted Data")
plt.ylabel('Y')
plt.xlabel('X')
plt.title("Both Random")
plt.legend()
plt.show()
Output


Quadratic
For quadratic I have increased the random int range to 50
def randomize(x,randomtype):
  n=len(x)
  a=[i for i in x]
  for i in range(n):
    if randomtype==RandomTypes.positive:
      randomvalue=random.randint(0,50)
    elif randomtype==RandomTypes.negative:
      randomvalue=random.randint(-50,50)
    else:
      randomvalue=random.randint(-50,50)


    a[i]+=randomvalue

  return a
Quadratic
x=[1,2,3,4,5,6,7,8,9,10]
y=[1,4,9,16,25,36,49,64,81,100]
degree=1


#Original

outputy=y
model = poly.polyfit(x, outputy, deg=degree)# Generate the model
predictedy=poly.polyval(x,model)
coeff=r2_score(outputy, predictedy)
print("Original","\nX",x,"Y",y,"\nOriginal Y",outputy,"\nPredicted Y",predictedy,"\n coefficient of correlation",coeff)
equation=str(numpy.poly1d(numpy.flip(model)))# Get the model output formatted as a equation. Model is an nparray, poly1d requires the array of coefficients in reverse order. Hence th flip.
print("The equation is Y=\n ",equation)
plt.scatter(x,y,color="orange")
plt.plot(x, y,'orange',label="Original Data")
plt.scatter(x,outputy,color="blue")
plt.plot(x, outputy,'blue',label="Original Data")
plt.scatter(x,predictedy,color="green")
plt.plot(x, predictedy,'green',label="Predicted Data")
plt.ylabel('Y')
plt.xlabel('X')
plt.title("Original")
plt.legend()
plt.show()


#Positive

outputy=randomize(y,RandomTypes.positive)
model = poly.polyfit(x, outputy, deg=degree)# Generate the model
predictedy=poly.polyval(x,model)
coeff=r2_score(outputy, predictedy)
print("Positive Random","\nX",x,"Y",y,"\nRandomized Y",outputy,"\nPredicted Y",predictedy,"\n coefficient of correlation",coeff)
equation=str(numpy.poly1d(numpy.flip(model)))# Get the model output formatted as a equation. Model is an nparray, poly1d requires the array of coefficients in reverse order. Hence th flip.
print("The equation is Y=\n ",equation)
plt.scatter(x,y,color="orange")
plt.plot(x, y,'orange',label="Original Data")
plt.scatter(x,outputy,color="blue")
plt.plot(x, outputy,'blue',label="+ve Randomized Data")
plt.scatter(x,predictedy,color="green")
plt.plot(x, predictedy,'green',label="Predicted Data")
plt.ylabel('Y')
plt.xlabel('X')
plt.title("Positive Random")
plt.legend()
plt.show()


#Negative

outputy=randomize(y,RandomTypes.negative)
model = poly.polyfit(x, outputy, deg=degree)# Generate the model
predictedy=poly.polyval(x,model)
coeff=r2_score(outputy, predictedy)
print("Negative Random","\nX",x,"Y",y,"\nRandomized Y",outputy,"\nPredicted Y",predictedy,"\n coefficient of correlation",coeff)
equation=str(numpy.poly1d(numpy.flip(model)))# Get the model output formatted as a equation. Model is an nparray, poly1d requires the array of coefficients in reverse order. Hence th flip.
print("The equation is Y=\n ",equation)
plt.scatter(x,y,color="orange")
plt.plot(x, y,'orange',label="Original Data")
plt.scatter(x,outputy,color="blue")
plt.plot(x, outputy,'blue',label="+ve Randomized Data")
plt.scatter(x,predictedy,color="green")
plt.plot(x, predictedy,'green',label="Predicted Data")
plt.ylabel('Y')
plt.xlabel('X')
plt.title("Negative Random")
plt.legend()
plt.show()

#Both


#Positive

outputy=randomize(y,RandomTypes.both)
model = poly.polyfit(x, outputy, deg=degree)# Generate the model
predictedy=poly.polyval(x,model)
coeff=r2_score(outputy, predictedy)
print("Both Random","\nX",x,"Y",y,"\nRandomized Y",outputy,"\nPredicted Y",predictedy,"\n coefficient of correlation",coeff)
equation=str(numpy.poly1d(numpy.flip(model)))# Get the model output formatted as a equation. Model is an nparray, poly1d requires the array of coefficients in reverse order. Hence th flip.
print("The equation is Y=\n ",equation)
plt.scatter(x,y,color="orange")
plt.plot(x, y,'orange',label="Original Data")
plt.scatter(x,outputy,color="blue")
plt.plot(x, outputy,'blue',label="Both Randomized Data")
plt.scatter(x,predictedy,color="green")
plt.plot(x, predictedy,'green',label="Predicted Data")
plt.ylabel('Y')
plt.xlabel('X')
plt.title("Both Random")
plt.legend()
plt.show()


Constant
x=[1,2,3,4,5,6,7,8,9,10]
y=[25,25,25,25,25,25,25,25,25,25]
degree=1


#Original

outputy=y
model = poly.polyfit(x, outputy, deg=degree)# Generate the model
predictedy=poly.polyval(x,model)
coeff=r2_score(outputy, predictedy)
print("Original","\nX",x,"Y",y,"\nOriginal Y",outputy,"\nPredicted Y",predictedy,"\n coefficient of correlation",coeff)
equation=str(numpy.poly1d(numpy.flip(model)))# Get the model output formatted as a equation. Model is an nparray, poly1d requires the array of coefficients in reverse order. Hence th flip.
print("The equation is Y=\n ",equation)
plt.scatter(x,y,color="orange")
plt.plot(x, y,'orange',label="Original Data")
plt.scatter(x,outputy,color="blue")
plt.plot(x, outputy,'blue',label="Original Data")
plt.scatter(x,predictedy,color="green")
plt.plot(x, predictedy,'green',label="Predicted Data")
plt.ylabel('Y')
plt.xlabel('X')
plt.title("Original")
plt.legend()
plt.show()


#Positive

outputy=randomize(y,RandomTypes.positive)
model = poly.polyfit(x, outputy, deg=degree)# Generate the model
predictedy=poly.polyval(x,model)
coeff=r2_score(outputy, predictedy)
print("Positive Random","\nX",x,"Y",y,"\nRandomized Y",outputy,"\nPredicted Y",predictedy,"\n coefficient of correlation",coeff)
equation=str(numpy.poly1d(numpy.flip(model)))# Get the model output formatted as a equation. Model is an nparray, poly1d requires the array of coefficients in reverse order. Hence th flip.
print("The equation is Y=\n ",equation)
plt.scatter(x,y,color="orange")
plt.plot(x, y,'orange',label="Original Data")
plt.scatter(x,outputy,color="blue")
plt.plot(x, outputy,'blue',label="+ve Randomized Data")
plt.scatter(x,predictedy,color="green")
plt.plot(x, predictedy,'green',label="Predicted Data")
plt.ylabel('Y')
plt.xlabel('X')
plt.title("Positive Random")
plt.legend()
plt.show()


#Negative

outputy=randomize(y,RandomTypes.negative)
model = poly.polyfit(x, outputy, deg=degree)# Generate the model
predictedy=poly.polyval(x,model)
coeff=r2_score(outputy, predictedy)
print("Negative Random","\nX",x,"Y",y,"\nRandomized Y",outputy,"\nPredicted Y",predictedy,"\n coefficient of correlation",coeff)
equation=str(numpy.poly1d(numpy.flip(model)))# Get the model output formatted as a equation. Model is an nparray, poly1d requires the array of coefficients in reverse order. Hence th flip.
print("The equation is Y=\n ",equation)
plt.scatter(x,y,color="orange")
plt.plot(x, y,'orange',label="Original Data")
plt.scatter(x,outputy,color="blue")
plt.plot(x, outputy,'blue',label="+ve Randomized Data")
plt.scatter(x,predictedy,color="green")
plt.plot(x, predictedy,'green',label="Predicted Data")
plt.ylabel('Y')
plt.xlabel('X')
plt.title("Negative Random")
plt.legend()
plt.show()

#Both


#Positive

outputy=randomize(y,RandomTypes.both)
model = poly.polyfit(x, outputy, deg=degree)# Generate the model
predictedy=poly.polyval(x,model)
coeff=r2_score(outputy, predictedy)
print("Both Random","\nX",x,"Y",y,"\nRandomized Y",outputy,"\nPredicted Y",predictedy,"\n coefficient of correlation",coeff)
equation=str(numpy.poly1d(numpy.flip(model)))# Get the model output formatted as a equation. Model is an nparray, poly1d requires the array of coefficients in reverse order. Hence th flip.
print("The equation is Y=\n ",equation)
plt.scatter(x,y,color="orange")
plt.plot(x, y,'orange',label="Original Data")
plt.scatter(x,outputy,color="blue")
plt.plot(x, outputy,'blue',label="Both Randomized Data")
plt.scatter(x,predictedy,color="green")
plt.plot(x, predictedy,'green',label="Predicted Data")
plt.ylabel('Y')
plt.xlabel('X')
plt.title("Both Random")
plt.legend()
plt.show()


The source codde is available at this link on Colab
Just consider the coefficients of correlation that we got for the linear, quadratic and constant cases.
For linear we have
Original 1.0
Positive Random 0.8981
Negative Random 0.7438
Both Random 0.5721

Quadratic
Original 0.9497
Positive Random 0.8087
Negative Random 0.2991
Both Random 0.6404

Constant (Fully random)
Original 0.0
Positive Random 0.0001
Negative Random 0.0900
Both Random 0.0143
We are attempting to fit a Linear Regression to a linear sequence, quadratic sequence and a constant sequence. The fit is fairly good except for the constant case which is fully random. Please run this code and inform me if you have any problems.
No code next week, we will discuss the significance of these results next week.
🙂